Introducing
BI Similarity

Identify and compare similar BI reports across data, visuals, and transformations.

Why is this useful?

BI Similarity helps organizations to make better use of their data, improve efficiency, and gain valuable insights that drive informed decision-making by:

Reducing the number of reports by cleaning up and avoiding redundant reports (Cost efficiency)
Finding related information and tracking the quality of the report (Governance)
Ensuring consistency across reports (Trust)

For Executives

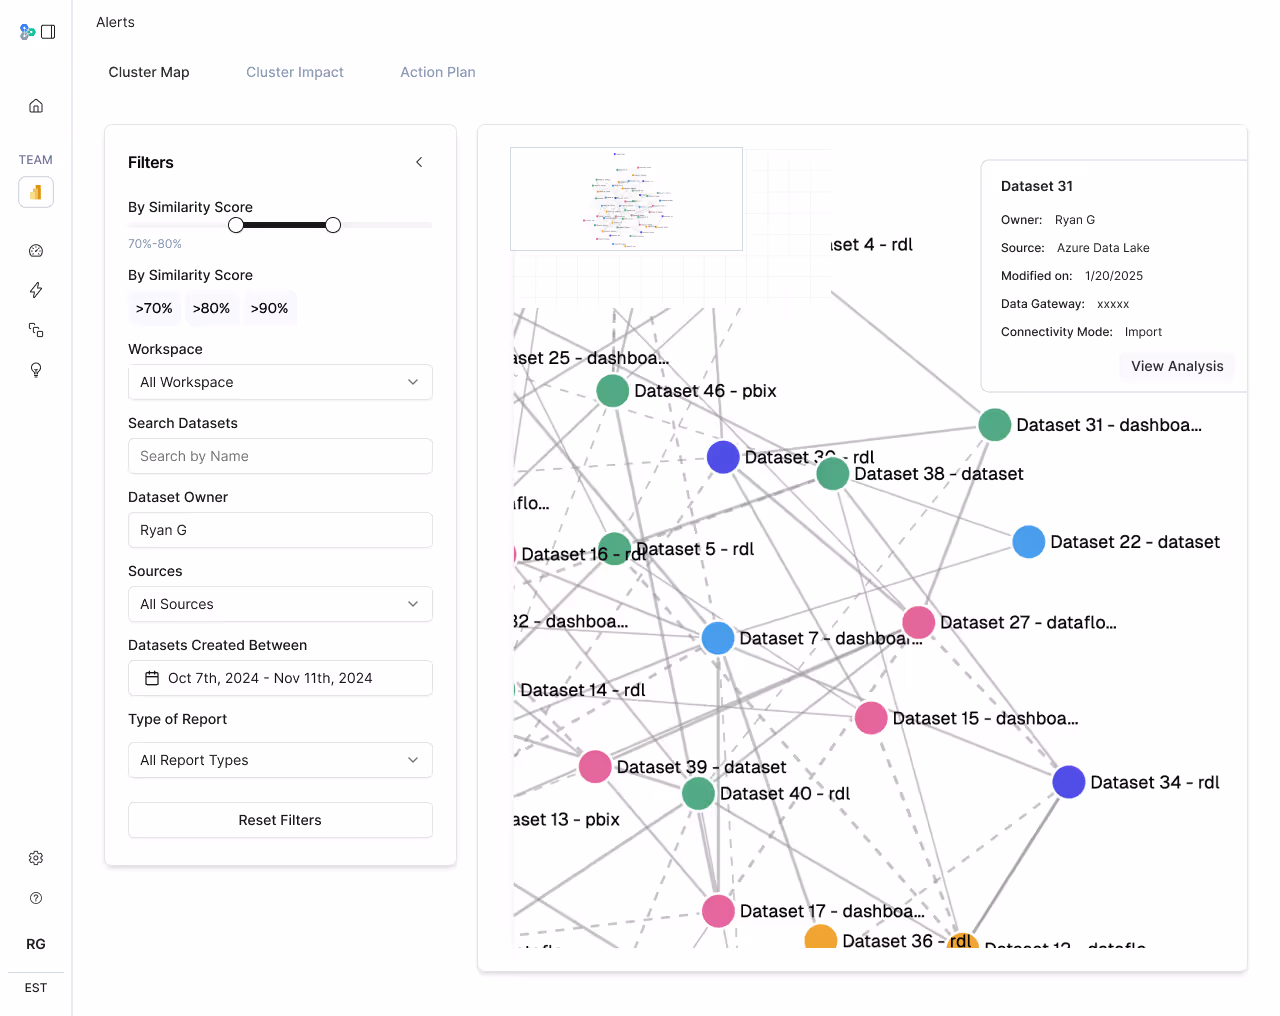
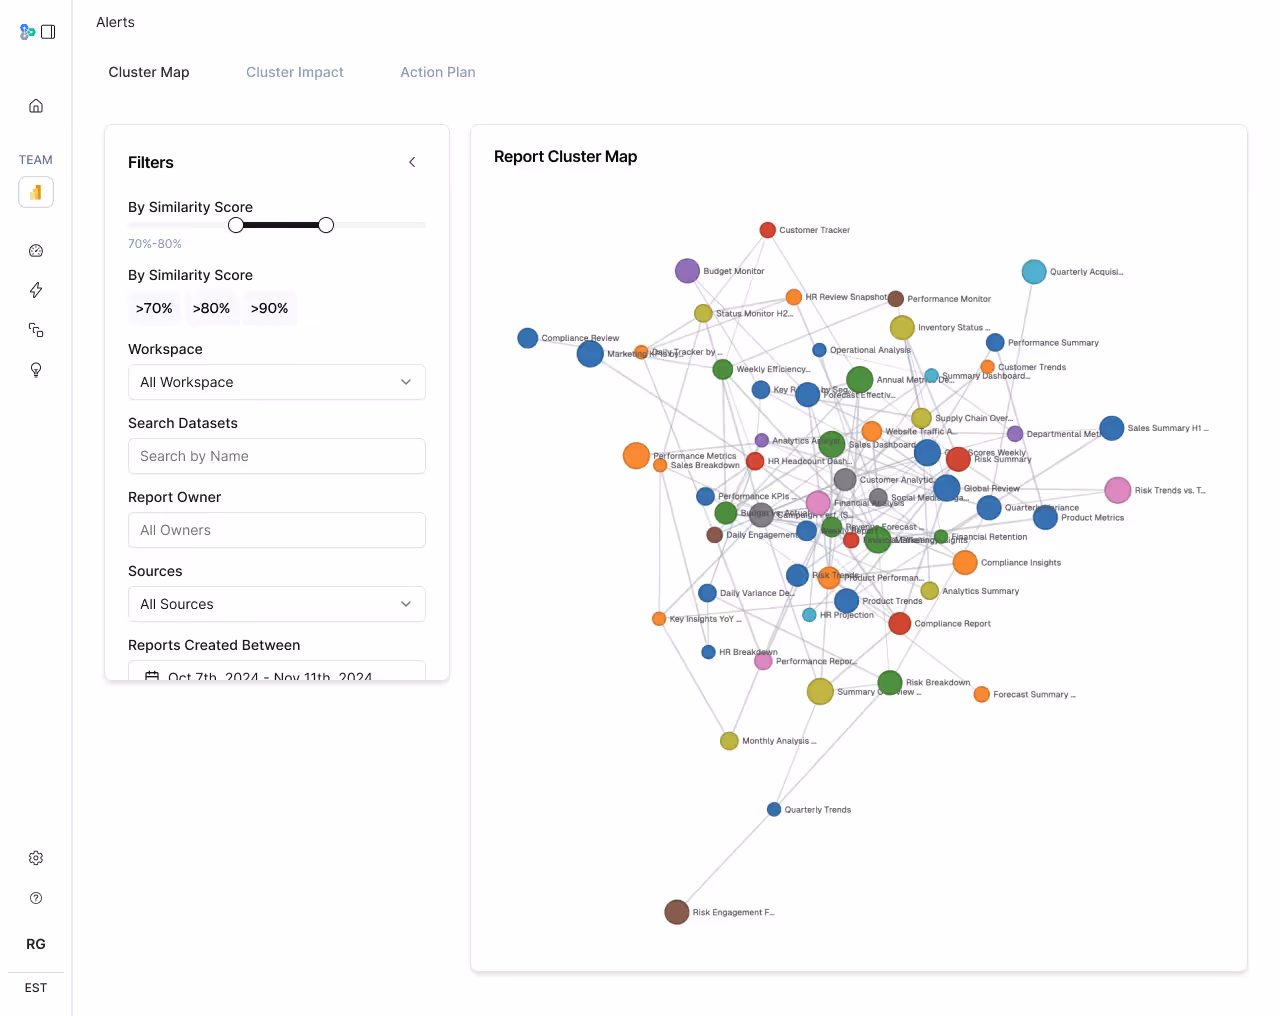
Duplicate or overlapping reports create confusion and mistrust in data, leading to inconsistent, misinformed, or even conflicting decisions across teams and leadership.

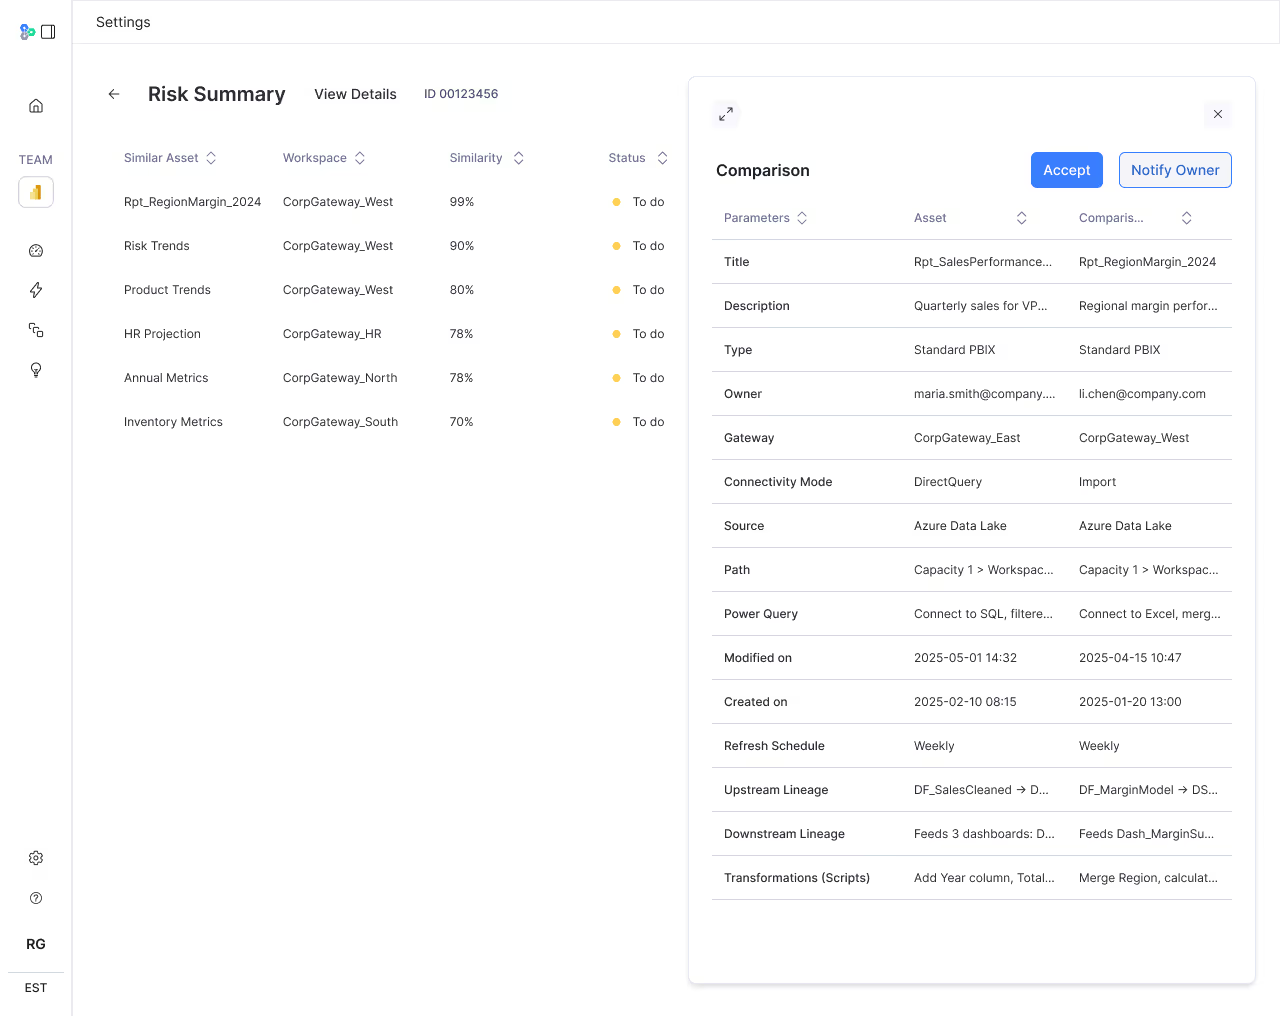
Identifying similar reports helps enforce a single source of truth, ensuring that data assets are accurate, well-managed, and aligned with governance standards.

Redundant reports increase storage, maintenance, and licensing costs; reducing duplication directly impacts the bottom line by improving operational efficiency.

For BI Admins

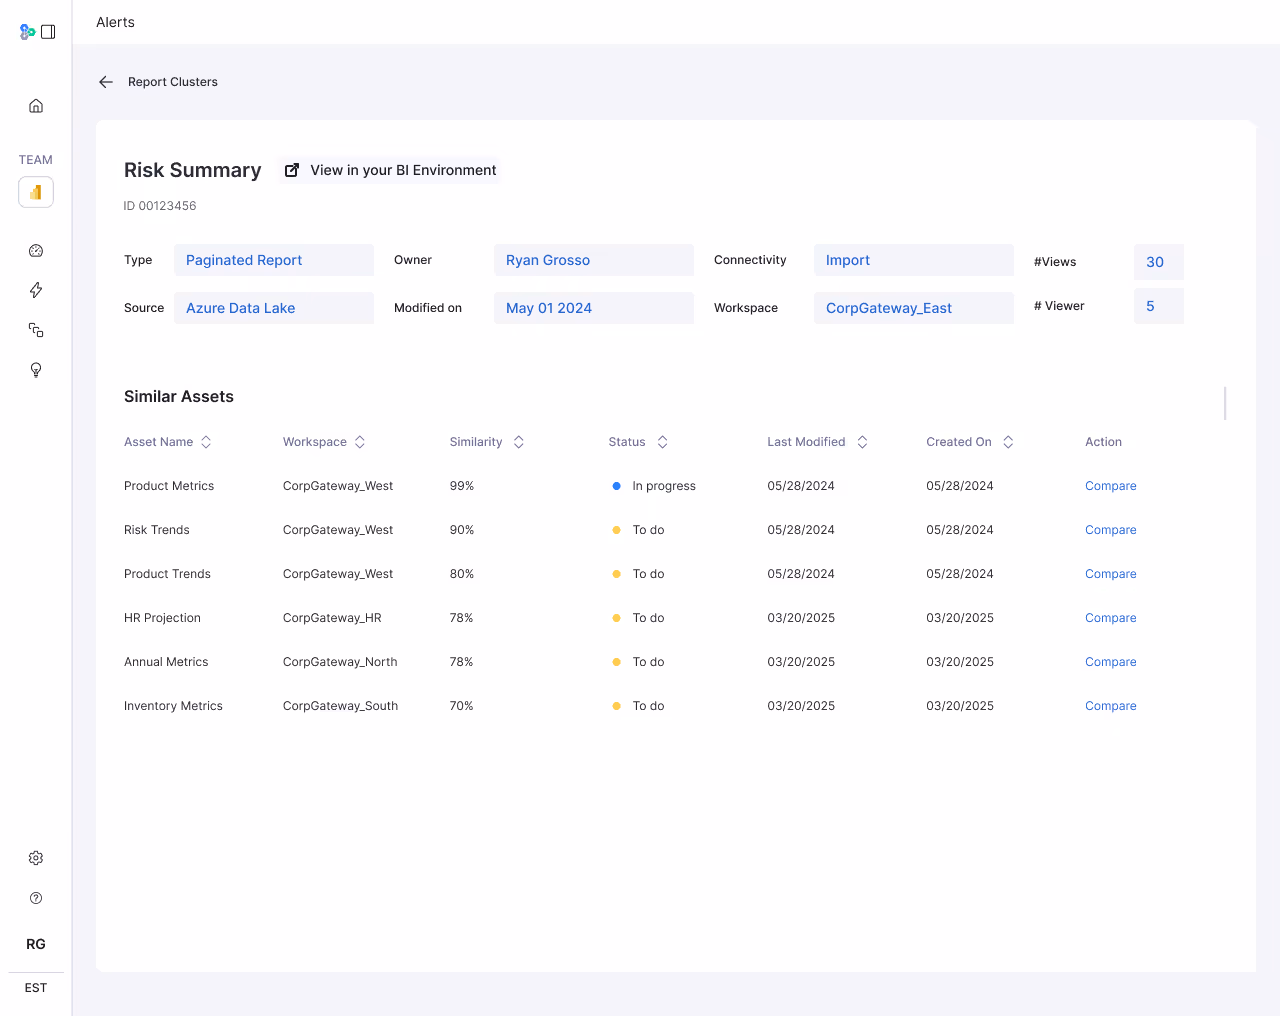
Identifying similar reports helps reduce duplicate content, saving storage space, streamlining maintenance, and improving platform performance at scale.

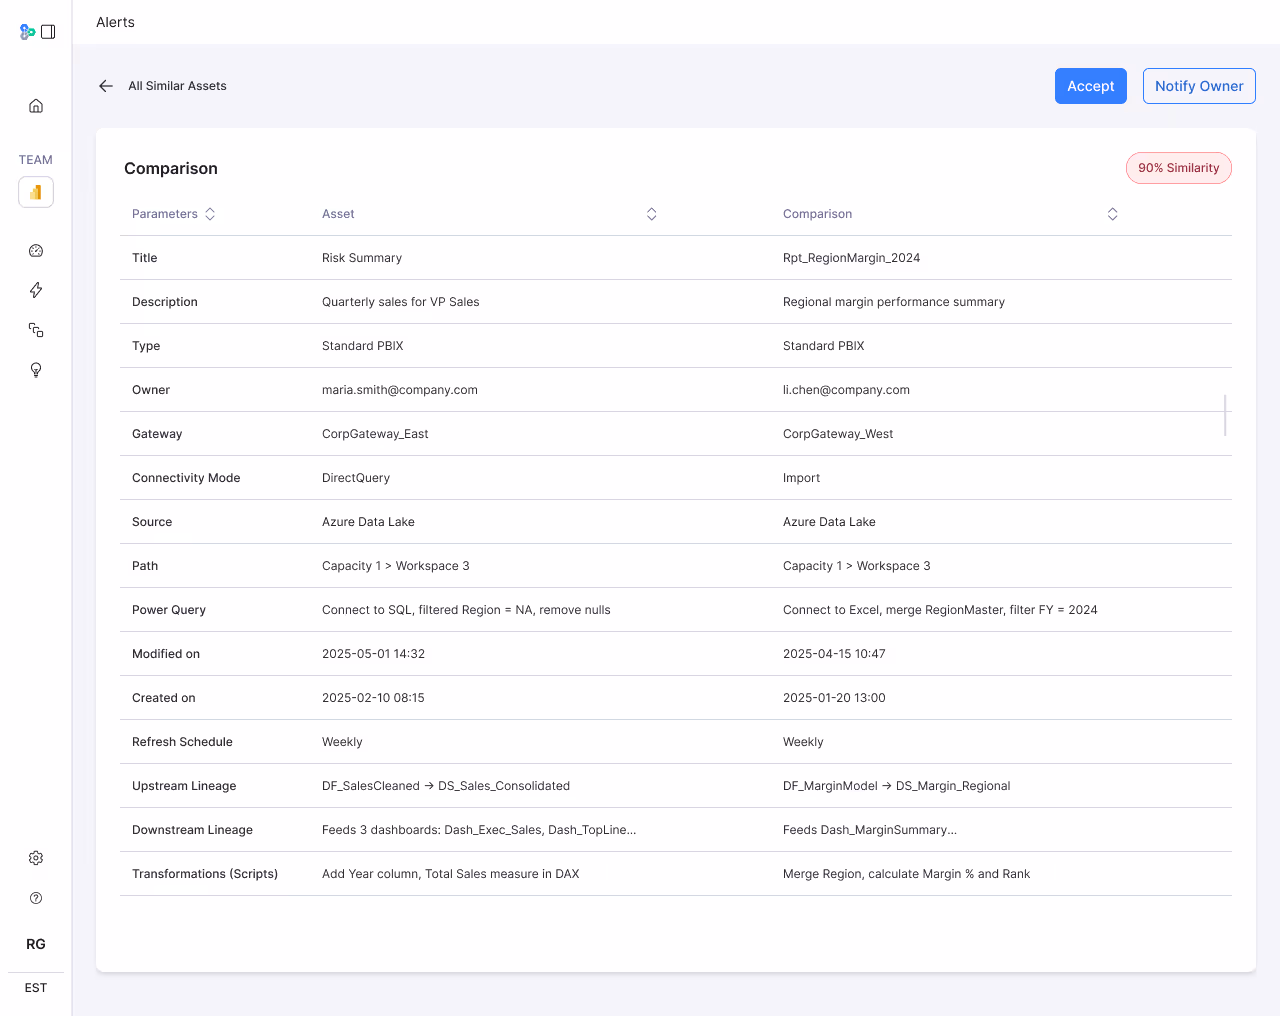
Highlighting overlapping reports reinforces a single source of truth, helping prevent version drift and reducing the risk of errors across teams.

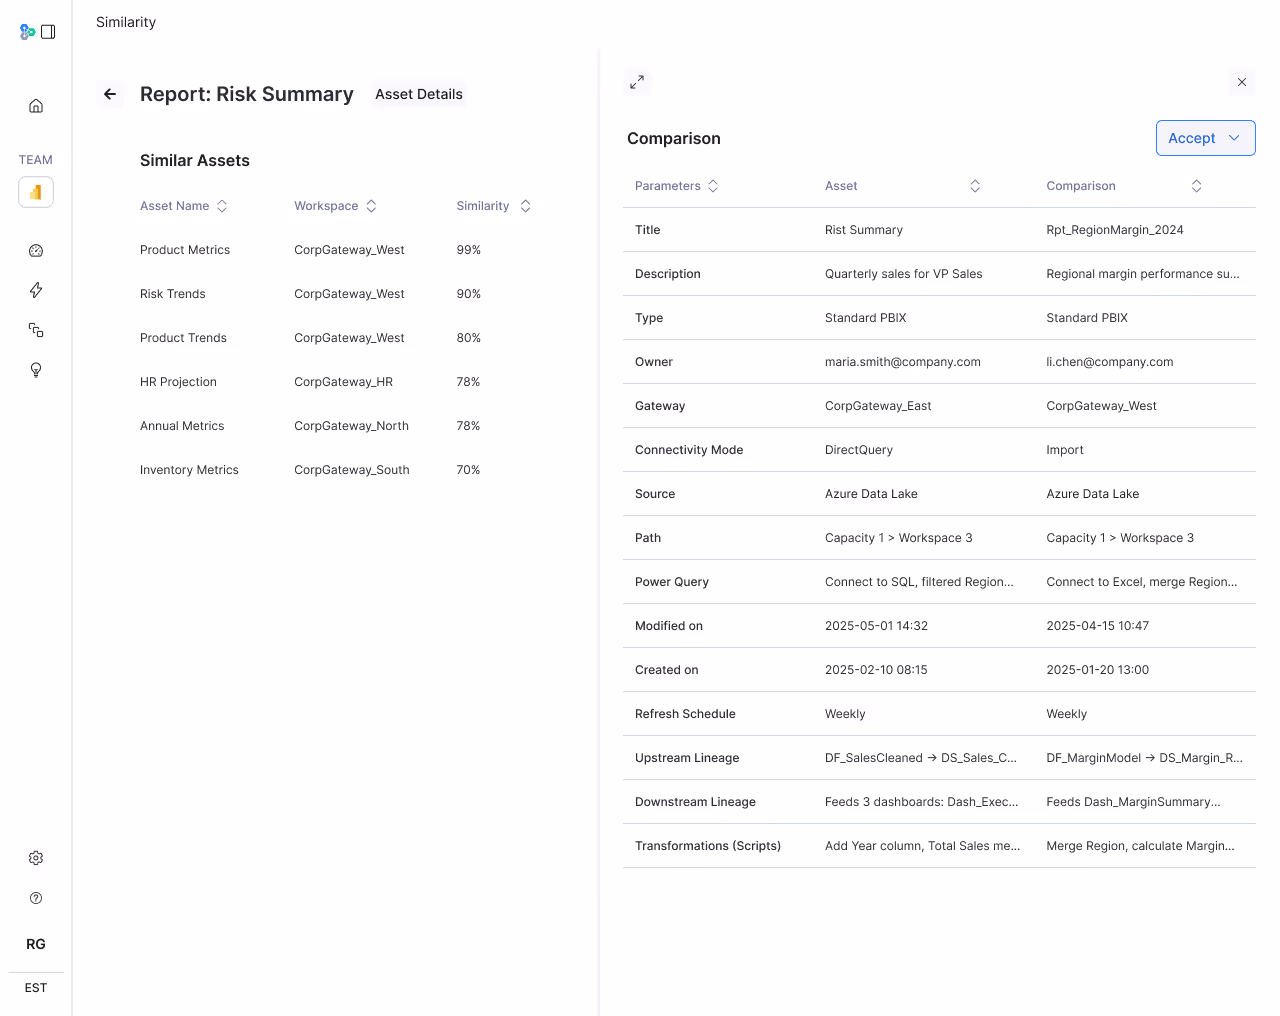
Eliminating report clutter simplifies the user interface, making it easier for users to find what they need and increasing overall platform adoption.

Better visibility into report duplication strengthens oversight, supports audit readiness, and helps enforce compliance policies across the BI environment.

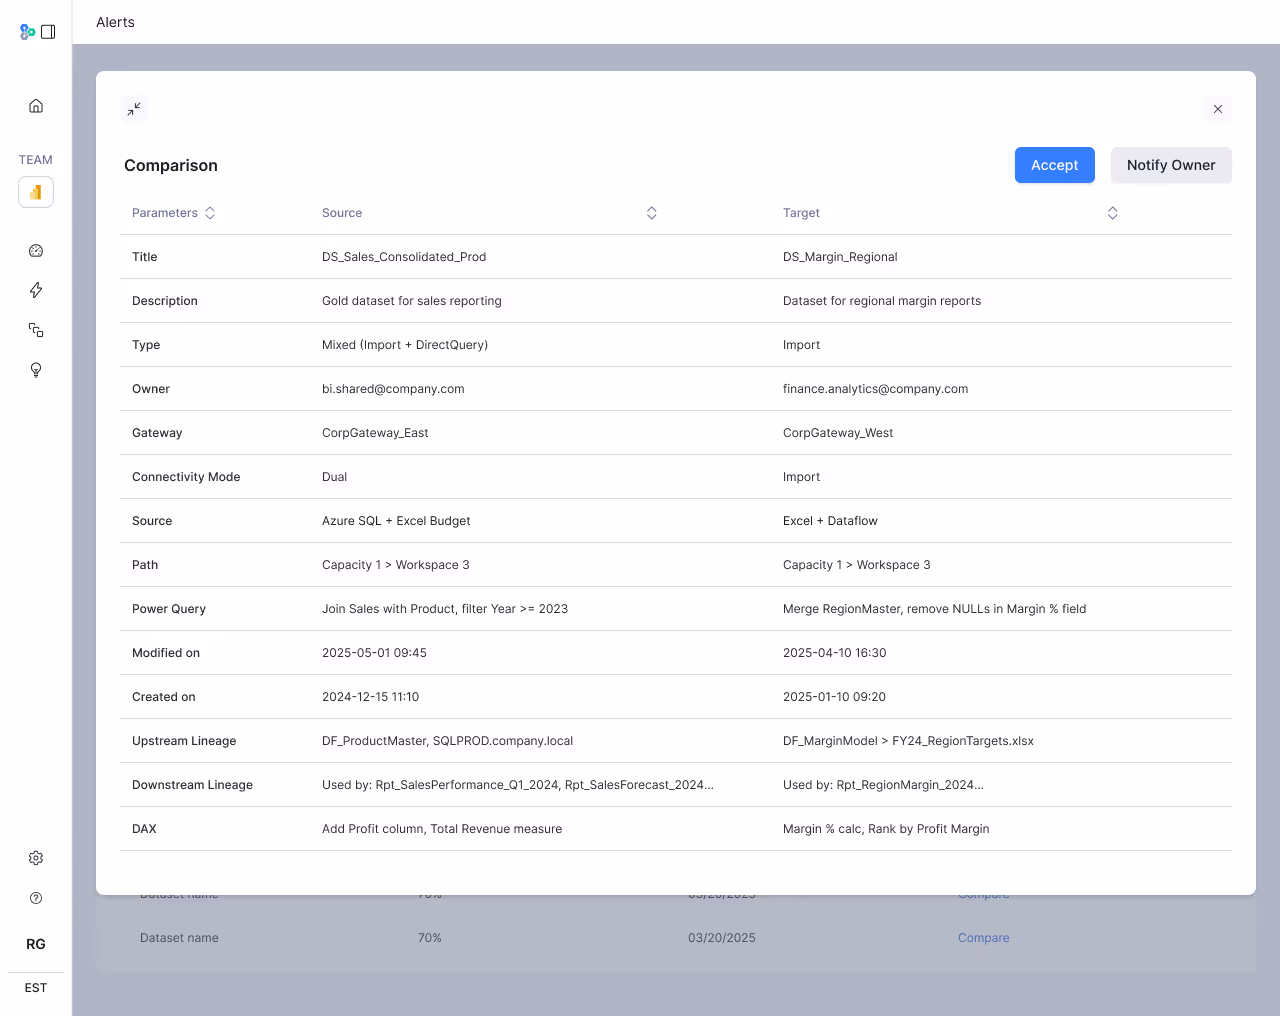
Reducing redundant development efforts enables teams to focus on innovation, speeds up delivery, and minimizes resource waste across BI projects.

How we do it

Datalogz uniquely creates BI Ops through three pillars

Costs

  • Asset lifecycle management
  • License optimization
  • Compute management

Risks

  • Publishing & certification processes
  • Multi-environment change control
  • Metadata synchronization

Activity

  • Standardize activity across multiple BI tools
  • View detailed breakdown of usage
  • Flag anomalies in viewing patterns and bad actors

users

The home for BI Admins

Change your role from reactive to proactive with real-time system recommendations

Save your company $100k+ per month by cleaning your environment

Prevent high risks data mistakes… Like the CEO viewing a stale report

Save time. Reduce risks. Cut costs.

Book a Demo Now!

integrations

Table Connectors

Snowflake Database Support
Snowflake
AWS Database Support
Amazon Redshift
Google Big Query Database Support
Google Big Query
IDM DB2 Database Support
IBM DB2
coming soon
Oracle Database Support
Oracle
Microsoft SQL Database Support
Microsoft SQL Server
MySQL Database Support
MySQL
Postgres SQL Database Support
PostGreSQL
CSV Database Support
CSV
Power BI Database Support
Power BI
Tableau Database Support
Tableau
Mode Database Support
Mode
coming soon
Looker Database Support
Looker
coming soon
Dbt Database Support
dbt
Neo4j Database Support
Neo4j
coming soon
AWS Database Support
Amazon Neptune
coming soon
ArangoDB Database Support
ArangoDB
coming soon
AWS DynamoDb Database Support
DynamoDB
coming soon
Azure Cosmos Database Support
CosmosDB
coming soon
Scylla Database Support
ScyllaDB
coming soon
Cassandra Database Support
Cassandra
coming soon

amundsen

Datalogz is built on top of Lyft's Open Source Data Catalog Amundsen

Amundsen Support

prices

Reach your full data potential

Community Edition - datalogz hosted
$ 39 / user / month

Free Trial

Instantly get started

Cloud Integrations

All Features

Central Metadata Repository

Data Lineage

Get Started
self-hosted
Contact us

Host in your AWS, GCP, or Azure Environment

Custom Features

Premium Support

Get Started